

Understanding Bitcoin's Price: Supply Side
Understanding Bitcoin's Price: Supply Side
Part 1 of the Bitcoin Supply-Demand-Price Series

TLDR
Bitcoin’s price is extremely volatile, but its unique supply mechanics make it possible to understand that volatility from a supply-demand perspective, and thus understand price movements.
This article will focus on supply-side mechanics, but later articles will focus on demand-side mechanics.
Note from Author
Thank you for reading this post. I have two goals for this series: (1) educate on a simple way to understand Bitcoin’s current price and future price movements and, (2) to reach 10,000 subscribers to this Substack. If you are interested, please help out by Subscribing and sharing this post with your Bitcoin network.
Supply-Demand-Price
The “Law” of Supply and Demand states that price is determined by the relationship between supply and demand of a good, or in mathematical terms, price is a function of supply and demand. However, analyzing the pricing of goods based on supply and demand is complicated by two factors: (1) supply and demand are often dependent variables (ie, events that affect one also tends to affect the other) and (2) the function can change over time based on a myriad of external factors.
Bitcoin is unique to most other goods because its supply is fixed, knowable and predictable based on its code. In addition, now that Bitcoin is a tradable good with enough liquidity that its price can be meaningful, it’s possible to have insight into the supply-demand-price (SDP) function for Bitcoin. Understanding the SDP function provides incredible insight into questions such as: “What is causing Bitcoin’s price movement?” and “What might drive Bitcoin’s price movement next year?”.
PlanB’s stock-to-flow model takes advantage of the fixed supply mechanism to understand past price performance and predict future price movements. I will use PlanB’s stock-to-flow model (s2f) as a substitute for supply-side mechanics in this article (due to the ubiquitous understanding of the model within the community and because it generally captures the supply mechanism, although not price, well), however I may challenge this in future articles and propose additional models.
What Does Supply Tell Us About BTC’s Price?
There are times in Bitcoin’s history where supply mechanics explain almost 100% of Bitcoin’s price movement.
Here is a chart of Bitcoin’s price correlation with the s2f model. Notice the long periods of extremely high price correlation (the purple box shows correlations greater than 0.75)
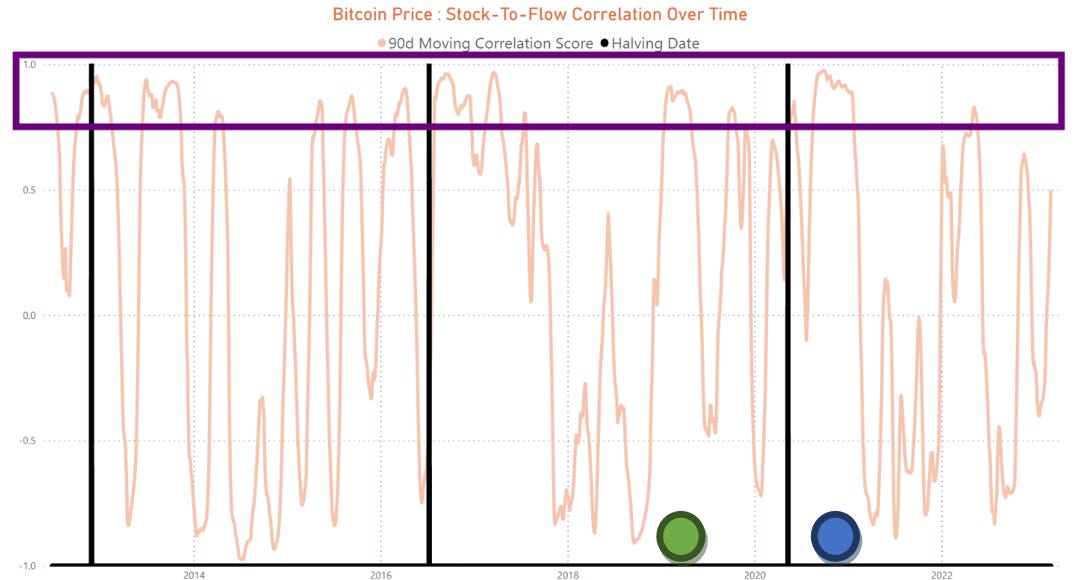
There are two areas of interest on this chart:
The Green Dot - This was a period of relative sideways action in Bitcoin’s price from January - March 2019 and corresponding mid-cycle sideways action in the s2f model. With the exception of the failure of Quadriga Fintech, this was a period with little news and events for Bitcoin.
The Blue Dot - This period started 3 months after the 2020 halving and lasted from mid-August 2020 to mid-January 2021. This period corresponded to a rapid increase in both Bitcoin’s price and the s2f model.
I’m excluding prior periods of high correlation due to the fact that the s2f model was created in early 2019 and was statistically fitted to price data prior to 2019. However, it is worth noting that Bitcoin halvings seem to produce periods of high correlation between the Bitcoin price and supply mechanisms.
A quick note - high correlation between s2f and Bitcoin’s price does not mean that s2f is accurately predicting Bitcoin’s price, but rather the two are moving consistently in the same direction. A correlation analysis removes the price prediction
SDP Theory
I want to postulate a theory that I will explore in later articles, it goes like this:
Supply-side mechanics will drive Bitcoin’s price around Bitcoin halvings.
What does this mean? Well, under this theory you can expect a period where Bitcoin’s price will rise after each Bitcoin halving because the price will be highly correlated with the stock-to-flow. I believe this will occur both because of an actual supply “shock” (less Bitcoin will be minted after each halving) and because the narrative around Bitcoin will focus on that supply shock and thus market participants will be more supply-side-minded.
The first corollary of this theory is:
Bitcoin’s price will be driven by demand-side mechanics (aka narratives) during periods between halvings.
While supply mechanics will be the focus of market participants around the time of each Bitcoin halving due to the size of the supply shock relative to the demand mechanisms, Bitcoin’s price during the period between halvings will be driven mostly by demand mechanisms.
The second corollary of this theory is:
In the absence of demand narratives, the Bitcoin price will be correlated with the s2f model, which suggest sideways price action between halvings.
The s2f model is *mostly* sideways between halving events. During periods in which there is no strong demand narrative Bitcoin’s price will also be mostly sideways.
The third (and final) corollary is:
Given that the size of the supply shock of each halving drops with each halving, over time the supply mechanics of Bitcoin will no longer have any impact on price and demand will drive 100% of the Bitcoin price movement.
SDP Implications
The fact that halvings lead to price increases isn’t news to anyone. However, if you are willing to accept the above SDP theory then there is an interesting implication: periods between Bitcoin halving events can be best understood through the lens of demand mechanisms. That means that price action should be heavily correlated with certain demand metrics for Bitcoin, like exchange flows, wallet behavior, hodler behavior, etc., and the metrics that are most driving that price behavior can explain the narrative that is driving price. The SDP theory enables a deeper understanding of what is driving demand to and from Bitcoin. This will be the focus of my future articles in this series.
If you want to learn more about how demand narratives drive Bitcoin price (supported by data, of course!) then be sure to subscribe and share this article.
Kyle,
Great read as always!