
ICP Price Range Modeling
Announcing the ICP SD model

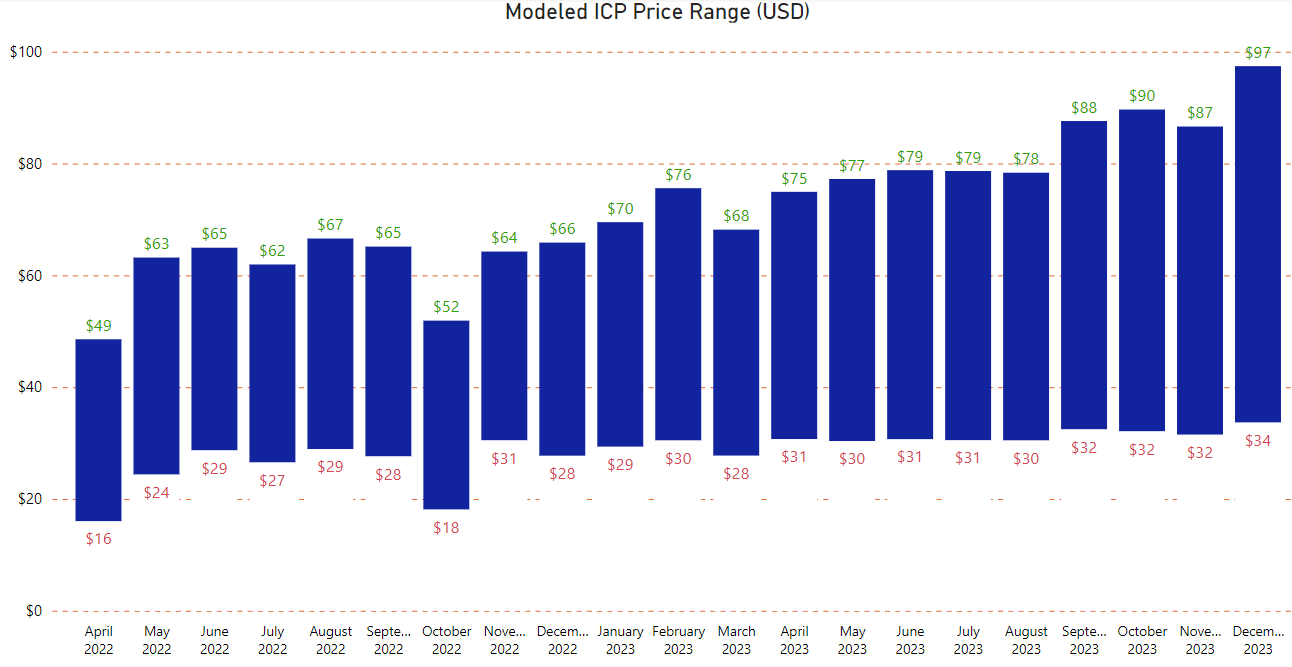
The below is a forecast model for the price range of ICP (in USD) for the next two years. The model uses the supply and demand expanded forecasts (previewed in yesterday’s post) as inputs.
Model Details
“All models are wrong, but some models are useful” - George Box
The forecast model uses only actual and forecasted ICP supply and demand as an input. The output of the model is the predicted low and high price for ICP by month.
The model’s training data was data from August 2021 through February 2022. The model will continually be retrained each month until the sample size is 15 months.
The model uses a 92.5% confidence interval to each side (high and low). This means under normal variation conditions the model should be expected to be wrong 7.5% of months to both the high side and low side (15% error in total).
The model’s inputs (supply and demand forecasts) will be updated routinely as new data is generated. This is particularly true for demand drivers, which are currently highly variable.
As stated above, the model will be updated and retrained as more data is generated. Expect the model to change drastically in the coming months. Over time, variations in the model will settle.
The model forecasts only on historic variation. Black swan events (and even grey swan events like the Ukraine-Russia conflict) will invalidate the model.
Note - this article is neither an endorsement nor encouragement to make a specific investment decision or follow a specific strategy. If you’re part of the #8YearGang, then don’t worry about price anyways :)
Month 1: April
Wrong lmao